How visual abstracts can help enhance uptake of research (and how to create them)
Posted on September 18, 2025 by the Canadian Paediatric Society | Permalink
Topic(s): Academic publishing, Paediatrics and Child Health, Professional education
By Pallavi Mukherjee, Editorial Coordinator, Paediatrics & Child Health

Background
Given that around 2.5 – 3 million articles are published annually on medical issues1, 2, it isn’t surprising that it takes 17 years for research evidence to reach clinical practice3. For research to influence clinical practice, it must be effectively communicated to audiences (such as policymakers, healthcare professionals, and patients)4. Presenting research findings in a visual way promises to improve audience reach and drive change5. Also called ‘graphical’ abstracts, they make use of our ability to rapidly process and retain visual over textual information6,7.
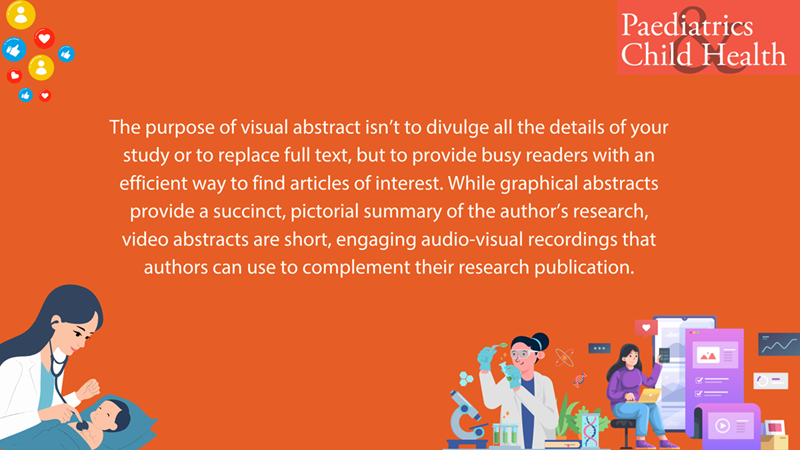
Paediatrics & Child Health encourages authors to submit visual abstracts (graphical or video abstracts) with their manuscripts. These abstracts give readers a quick, visual overview of an article’s main findings and information briefly8. The purpose of visual abstract isn’t to divulge all the details of a study or to replace full text, but to provide busy readers with an efficient way to find articles of interest9. While graphical abstracts provide a succinct, pictorial summary of the paper, video abstracts are short, engaging audio-visual recordings4,10,11.
More than 100 medical journals, including The New England Journal of Medicine and JAMA encourage authors to include visual abstracts9. As the addition of visual abstracts on social media is relatively new (since 20165), there is need for more quantitative studies to fully understand how effective visual abstracts are in communicating research10. Preliminary data suggest that visual abstracts play a role in increasing text abstract usage12 and Altmetric attention scores13.
Like any evolving process, it may take some time to optimize and develop clear guidelines for reporting social media data related to the impact of visual abstracts, but their impact on medical and scientific communication is undeniable.
Eight tips to making visual abstracts
While creating a visual abstract, don’t overthink it! You don’t have to spend hours or be a graphic designer to make one. Paediatrics & Child Health is looking for visual material that complements the paper.
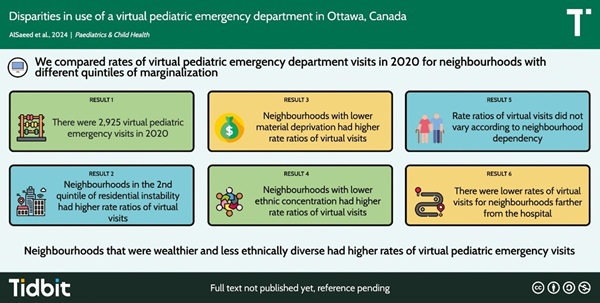
An example of a graphical abstract submitted to Paediatrics & Child Health. Habeeb Alsaeed, Maala Bhatt, Ewa Sucha, Nicholas Mitsakakis, Natalie Bresee, Melanie Bechard, Disparities in use of a virtual pediatric emergency department in Ottawa, Canada, doi.org/10.1093/pch/pxae07514
1. First, wrap up your paper : Develop your visual abstract after fully writing your manuscript. This will help you to fully understand your research story and highlight the key aspects of your paper. Ask yourself key questions:
a. Why did I decide to do this research?
b. What is the problem/knowledge gap my work addresses?
c. How do my key findings compare with what has been done previously?
d. And how does it matter to my peers and the public?
2. Storyboarding : Sketch out your ideas and organize your visual abstract in a logical way, so that a reader can take a quick glance and easily follow. You can use SmartArt Graphics on PowerPoint (process, cycle, list, matrix etc.) or search for similar elements on Canva.
3. Learn about your audience : It is important to understand your audience’s level of expertise when choosing the visual elements for your graphical abstract.
4. Less is more : Select the most important parts from different sections of your paper. This helps you keep your abstract succinct, as adding too many details can overwhelm the readers. The purpose of a visual abstract isn’t to replace full-text articles but to hook a broader audience.
5. What to keep in mind : For Paediatrics & Child Health, visual (graphical) abstracts should be one panel, 1200 pixels (width) x 900 pixels (height) at 300 ppi (which corresponds to 4 inches/10 cm x 3 inches/7.5 cm at 300 ppi). You can submit your graphical abstract as TIFF, PDF or JPG file and video abstracts as AVI or MP4 files.
6. Get feedback before you submit: Send your visual abstract to people within your profession but also outside to see if they understand the main crux of your paper just by looking at the visual abstract.
7. Designing graphical abstracts:
-
Choose a design program you are comfortable with such as Microsoft PowerPoint, Adobe Creative Cloud, Canva etc.
-
Select a colour palette (≤5 colours) and a font size (12- to 16-point UNICODE) to ensure legibility.
-
Use simple and clear visual elements/icons to communicate your research. For general graphical elements, you can use PowerPoint, Canva, Draw.io, and Adobe Illustrator. But for more specific visual elements, you can use software:
a. BioRender : for creating professional science figures; best for life sciences, medicine, and biology papers.
b. Mind the Graph : provides a library of science illustrations for creating compelling infographics from scratch. This tool is best for health professionals, scientists, and academicians.
c. ChemDraw : to draw out chemical reactions e.g., drawing out the structure of ADP in your manuscript.
d. If pictograms/images won’t help communicate your research work, you can always include data or charts. For information on different chart types and their uses, try this.
- Once you have created your graphical abstract, proofread and revise if necessary.
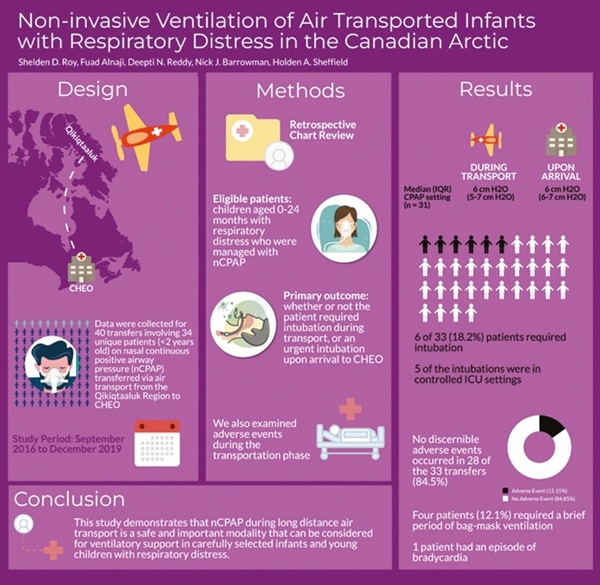
An example of a graphical abstract submitted to Paediatrics & Child Health. Shelden D Roy, Fuad Alnaji, Deepti N Reddy, Nick J Barrowman, Holden A Sheffield, Noninvasive ventilation of air transported infants with respiratory distress in the Canadian Arctic, Paediatrics & Child Health, 2022;27(5), p. 272–277, doi.org/10.1093/pch/pxac02015
8. Designing video abstracts :
-
Starting out: Have a clear picture of what you want to include in your video (e.g., what was the aim of your paper, what were your key findings, what clinical gap did your study fill etc.), create a storyboard to show each step or choose numbers16 and write down a script (just a few bullet points to give context of your study).
-
Select the mode of delivery:
i. Talking head i.e., record yourself
ii. Create animation with any tool that you’re comfortable with or make drawings of your own and record an animation. You can use images (with permission), charts, tables etc. to communicate with the audience.
iii. You can create a video in which you draw the aspects of your research you want to share with your audience, focusing the camera on the drawings, accompanied by a voiceover. This may require some drawing practice before recording the final video.
-
How to record your audio-visual : You can use a mobile phone to record your video or a digital camera and use the highest quality. Record your audio and ensure it is audible and clear. Remember to record your audio in a quiet room and if possible, use a plug-in microphone. Ensure your tone resonates with your intended audience. You can also add free music to your video (check license and copyrights).
-
End your video with a call to action : e.g., now that you’ve watched this video, don’t forget to read and share this paper. We want viewers to not stop after watching your video abstract - the goal is to pique their interest in your work, so they'll want to read your full-text article.
-
Putting it together : you can use any editing software that you are comfortable with (Canva Pro, PowerPoint, Animoto, Powtoon, Adobe Premiere Pro, iMovie) to put together your video abstract.
For more information about submitting your manuscript to Paediatrics & Child Health, please visit our website or email us at journal@cps.ca.
References
- Mulrow CD. BMJ 1994; 309: 597.
- Millar BC, Lim M. Ulster Med J 2022; 91: 67–78.
- Balas EA, Boren SA. Yearb Med Inform 2000; 65–70.
- Hoffberg AS, Huggins J, Cobb A, Forster JE, Bahraini N. Front Res Metr Anal 2020; Volume 5-2020.
- Ibrahim AM. ACG 2018; 113.
- Thorpe S, Fize D, Marlot C. Nature 1996; 381: 520–2.
- Ramos E, Concepcion BP. Semin Nephrol 2020; 40: 291–7.
- Ruzi SA, Lee NM, Smith AA. PLoS One 2021; 16: e0257866.
- Ibrahim AM. Surgery 2024; 175: 554–5.
- Jambor HK, Bornhäuser M. PLoS Comput Biol 2024; 20: e1011789-.
- Wray CM, Arora VM. Ann Surg 2017; 266.
- Zong Q, Huang Z, Huang J. Scientometrics 2023; 128: 3627–48.
- Bennett H, Slattery F. Scientometrics 2023; 128: 3793–804.
- Alsaeed H, Bhatt M, Sucha E, Mitsakakis N, Bresee N, Bechard M. Paediatr Child Health 2025; 30: 244–9.
- Roy SD, Alnaji F, Reddy DN, Barrowman NJ, Sheffield HA. Paediatr Child Health 2022; 27: 272–7.
- How to Make a Simple Video Abstract - a guide for authors. Youtube video, EMBO Press 2021.
Copyright
The Canadian Paediatric Society holds copyright on all information we publish on this blog. For complete details, read our Copyright Policy.
Disclaimer
The information on this blog should not be used as a substitute for medical care and advice. The views of blog writers do not necessarily represent the views of the Canadian Paediatric Society.
Last updated: Feb 26, 2026