Practice point

Recognizing and addressing atypical growth
Posted: Jul 11, 2023
Principal author(s)
Linda Casey MD, Tanis R. Fenton RD, PhD, Nutrition and Gastroenterology Committee
Paediatr Child Health 28(8):495–501. 
Abstract
While child growth evaluation is fundamental to paediatric practice, an increasingly complex clinical picture can complicate interpretation of growth patterns. This practice point uses representative case studies to illustrate key features of interpretation and response to commonly encountered growth patterns. Awareness of these common patterns and their etiologies will enhance the clinician’s ability to respond appropriately and minimize the risk of under- or over-diagnosis of growth impairment.
Keywords: Growth patterns; Management; Paediatrics; Screening
Background
Although growth charts describe expected growth trajectories in most children, there are many reasons why growth may differ from expected patterns. Deviations may reflect an ongoing or transient illness, or adjustment to a child’s genetic potential, or signal a serious underlying health issue. Because harm can result from either under- and over-diagnosing growth concerns, accurately identifying children who require further investigation or management is important.
Foundations
Growth evaluation is a screening tool, and a changing growth pattern helps identify children who require further attention. Investigation and intervention should focus on identifying and addressing health or nutritional issues of consequence to the child and, if none are found, on reassuring the family. The requirements for effective screening are:
- Accurate measurement, using well-maintained equipment and consistent techniques. When standardized techniques are not feasible, alternative options are needed[1][2].
- Serial measurements, with appropriate adjustment for prematurity[1][3] and consideration of the size of other members of the child’s family.
- Selection of appropriate reference data for comparison[1]-[3].
Common growth patterns
Four case studies highlighting common patterns of weight and length/height growth are presented below. Head circumference measurements are included where appropriate, and fall within expectations in all cases. Interpretation and responses illustrate approaches to a thorough and balanced assessment.
Case #1: Abigail is a 12-month-old female born after an uncomplicated pregnancy. She is breastfed and complementary foods were introduced appropriately. The parents’ only concern is that she is inconsistent both in the amount she eats and the foods she accepts and rejects. Abigail’s growth charts are shown in Figure 1[4].
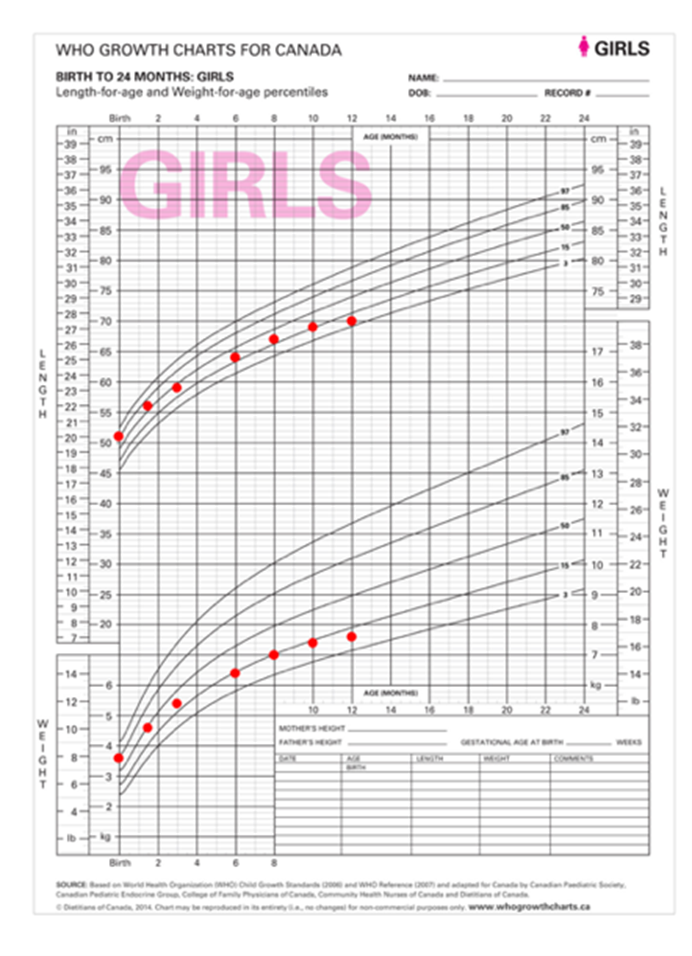
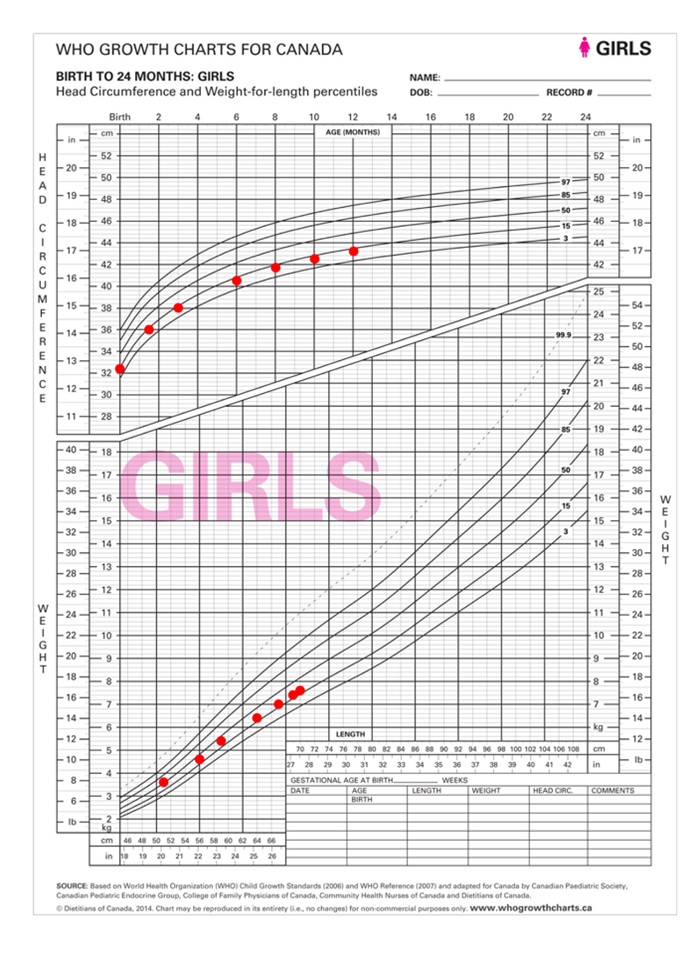
Figure 1. Growth charts for Abigail
Interpretation
Abigail’s weight and length are trending downward at the same time and to a similar degree. Weight-for-length is consistent and reassuring. Her health care provider (HCP) should first confirm that dietary and medical history do not identify concerns. Familial size may help to frame expectations. Healthy children can cross growth chart percentile curves early, as they adjust to extrauterine life, and much later, when puberty timing is earlier or later than average.
Response
Reassurance and follow-up are needed. Regular review of history and growth should continue and will likely reveal a more typical growth pattern after this child reaches her genetically determined size, which would usually occur within the first 2 years of life.
Comments:
- The interpretation of this growth pattern should be the same, regardless of where the child plots on the growth curves.
- Although this pattern violates expectations around crossing centiles, caution is needed to avoid introducing doubt concerning the child’s nutrition or overall health, which can disrupt normal feeding development as parents attempt to ‘correct’ a ‘problem’ that may not exist. Caregiver pressure to eat, or an over-emphasis on higher energy foods can lead to negative eating habits, preferences, and behaviours, as well as to unnecessary investigations and interventions, and altered relationships with both food and with parents doing the feeding[5][6]. Such effects can be serious, persistent, and difficult to change.
Case #2: Two-year-old Dennis was born small for gestational age, with no specific reason for this being identified. He was slow to accept solids and is experiencing some developmental delays that prolong his feeding times. Figure 2 shows growth charts for Dennis[4][7].
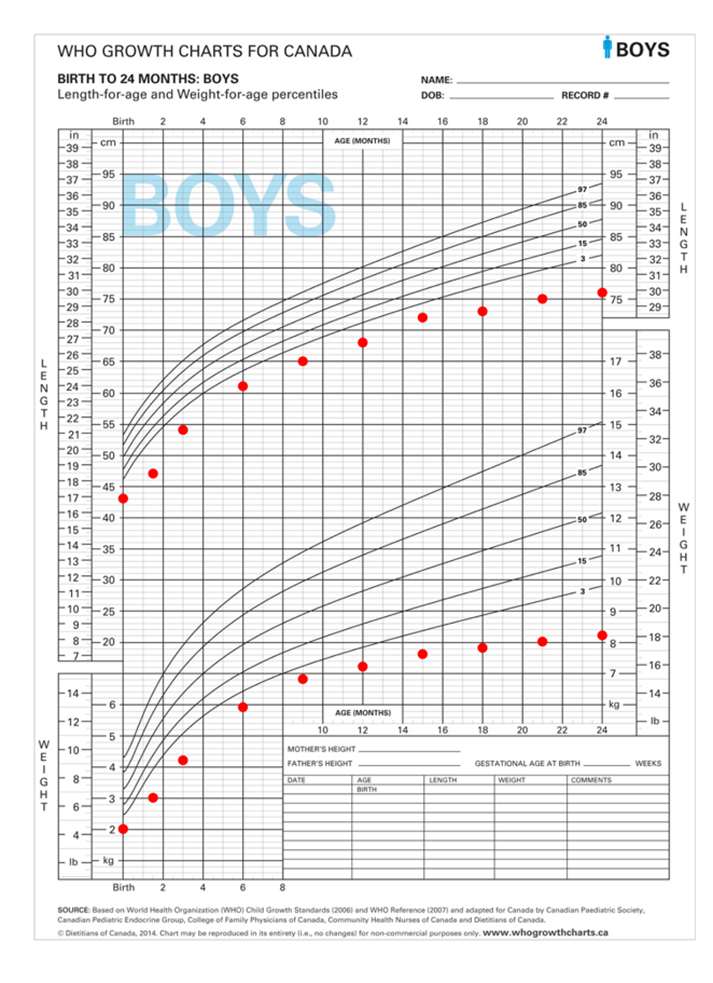
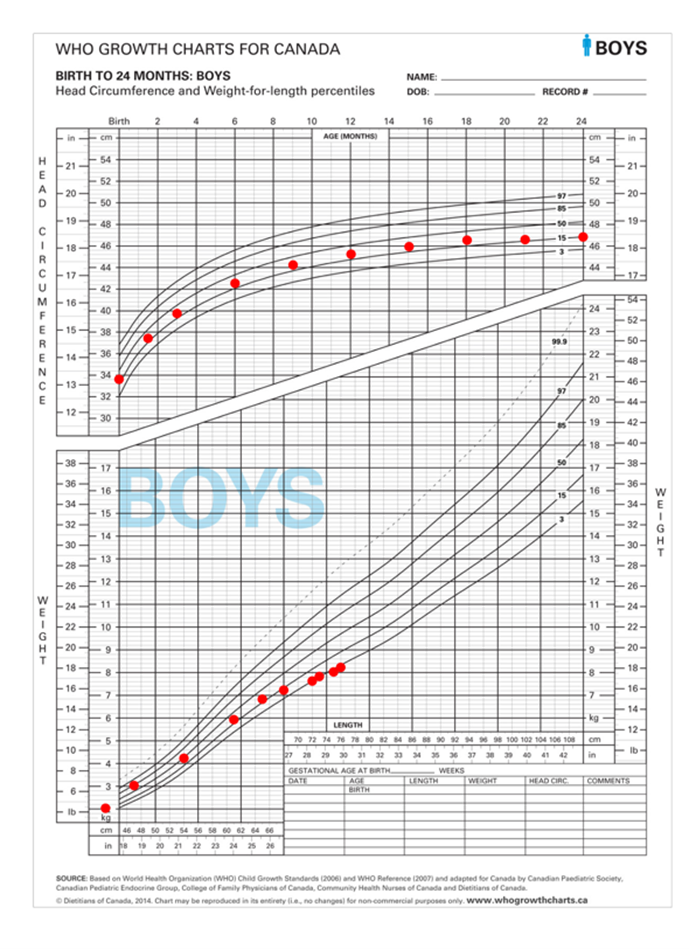
Figure 2. Growth charts for Dennis
Interpretation
Dennis’s growth, while below the curve, had tracked nicely, paralleling the curve until about 9 to 15 months. Then, his weight dipped first, followed by his length growth, and both moved gradually further away from expected curve lines. Although the last four measures on his weight-for-length chart appear to be reassuring, this pattern has resulted from sequential declines in weight and length gain. This pattern—decreasing weight gain followed by decreasing linear growth—strongly suggests a nutritional deficit.
Response
Detailed medical, nutrition and oral feeding, and social histories are required, along with nutritional biochemistry testing and a physical examination. Additional investigations will be based on the results obtained.
Comments:
- When poor growth is the manifestation of medical or nutritional compromise (or both), the resolution of underlying issues should improve growth, with attainment of a growth rate comparable to that expected for this child’s age. Individual factors will influence the timing and magnitude of catch-up.
- Some congenital or genetic conditions influence growth patterns, making the recognition of a concurrent nutritional compromise more difficult. Only after a thorough nutrition assessment and correction of deficiencies (micronutrients specifically), should a growth pattern like Dennis’s be attributed to an underlying condition. When nutritional support is introduced, careful monitoring and follow-up are needed to ensure improved function, quality of life, and the growth of lean tissue (linear growth and muscle mass) rather than disproportionate fat gain. Dietitian consultation, when available, can be invaluable to assessment and management.
- For children below (or above) the curves for whom percentiles are recorded as “<3 percentile” (or “>97 percentile”), z-scores may be helpful toward describing changes in growth. A z-score (standard deviation score) of 0 is equivalent to the 50th percentile. Values above the 50th percentile become increasingly positive, and values below the 50th percentile become increasingly negative. Z-scores can be calculated in some electronic medical records or using online applications (IOS; Android).
In the example below, a progressive decline in growth would be difficult to identify using percentiles alone. As with all growth assessments, trends are more informative than small variations.
|
Age (months) |
Weight (kg) |
Percentile |
Weight z-score |
Length (cm) |
Percentile |
Length z-score |
|
12 |
7.2 |
0.4 |
-2.6 |
68 |
<0.1 |
-3.3 |
|
15 |
7.6 |
0.3 |
-2.7 |
72 |
0.2 |
-2.8 |
|
18 |
7.8 |
0.1 |
-3.0 |
73 |
<0.1 |
-3.4 |
|
21 |
8 |
<0.1 |
-3.2 |
75 |
<0.1 |
-3.5 |
|
24 |
8.2 |
<0.1 |
-3.4 |
76 |
<0.1 |
-3.6 |
Case #3: Ella is a happy, healthy 5-year-old who has recently started school, and her mom has noticed that she is smaller than most of her peers. Both parents say she is not a big eater, but Ella does eat a variety of healthy foods and has no concerning symptoms. Ella’s growth is depicted in Figure 3[4][7].
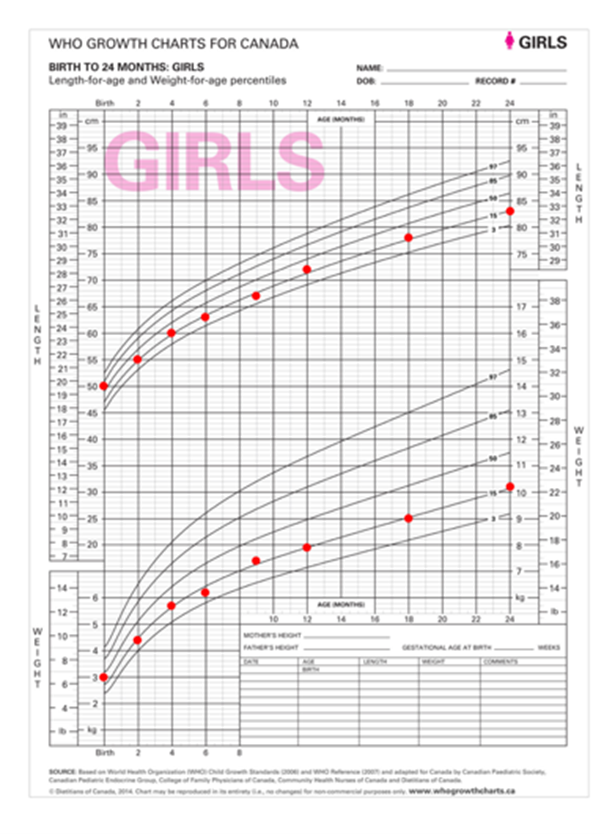
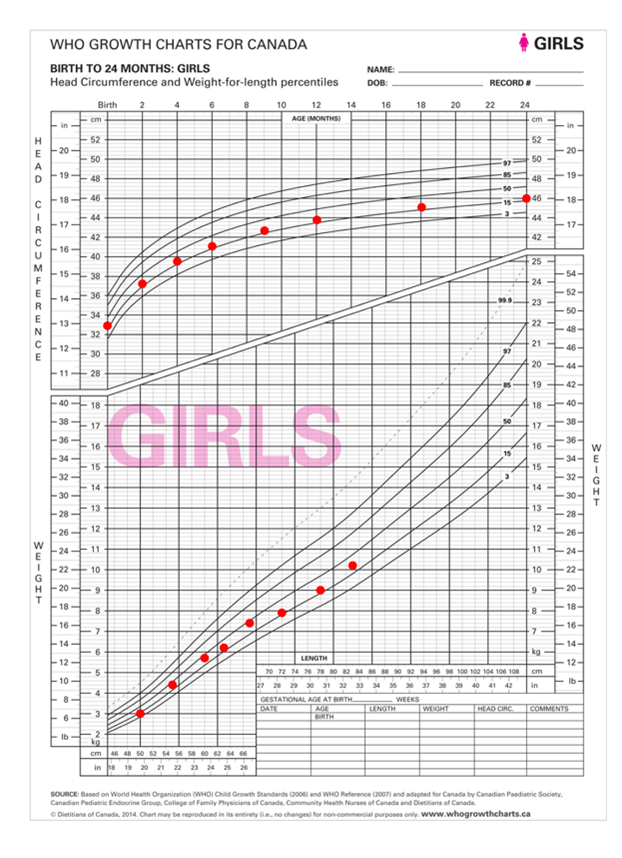
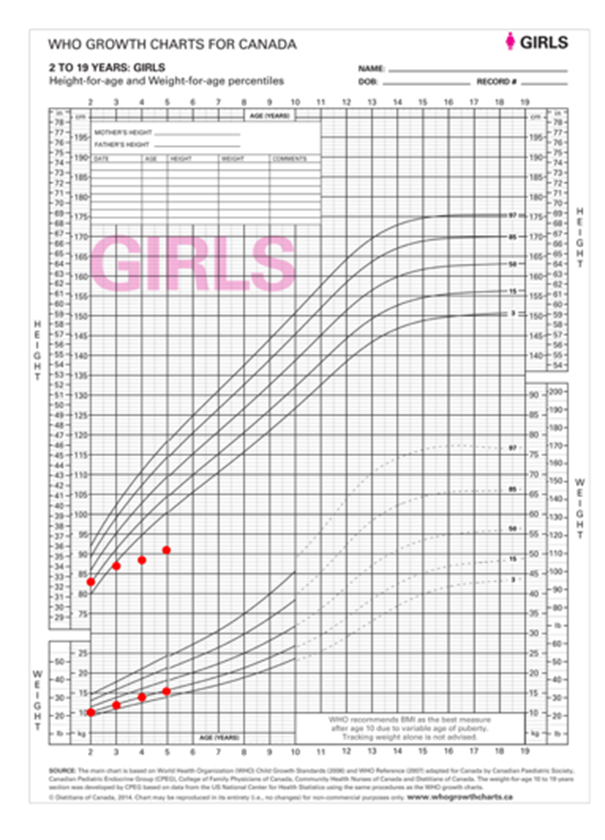
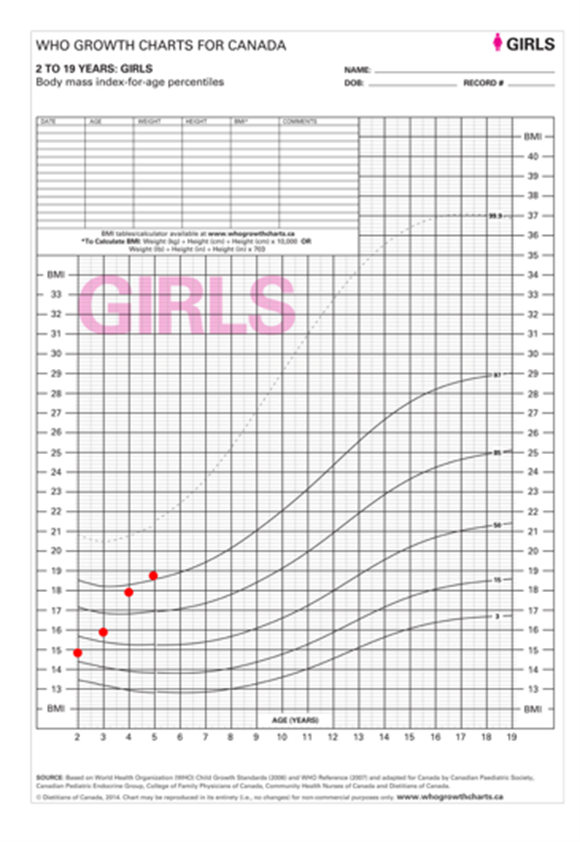
Figure 3. Growth charts for Ella
Interpretation
Growth tracked nicely along the 10th to 15th percentile, with only small fluctuations until about the age of 3 years, after which Ella’s rate of linear growth decreased. The body mass index (BMI) chart shows an increasing BMI trajectory, but this was caused by decreasing linear growth rather than accelerated weight gain. This pattern is most consistent with growth failure of hormonal etiology.
Response
Basic investigation with endocrinology referral is needed. While unlikely to be nutritional in origin, this growth pattern is also seen in rickets. A dietitian referral, when available, could help to document a comprehensive dietary analysis. A full medical history and physical examination, and complete screening bloodwork (including renal function, liver function, and bone health) are indicated.
Comments:
- Accurate measurement of linear growth in children is often challenging, but repeated measurement and z-scores help clarify evolving trends.
Case #4: Eight-year-old Ali has come for his yearly check-up, and after accurately measuring his weight and height, you observe the following on his growth records (Figure 4)[7]:
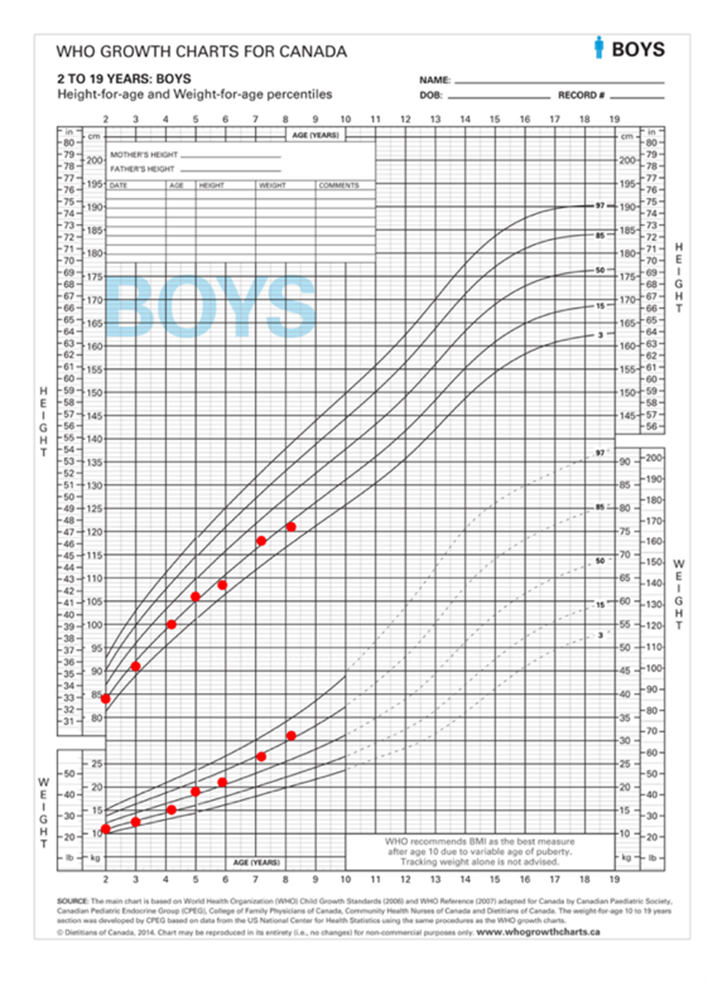
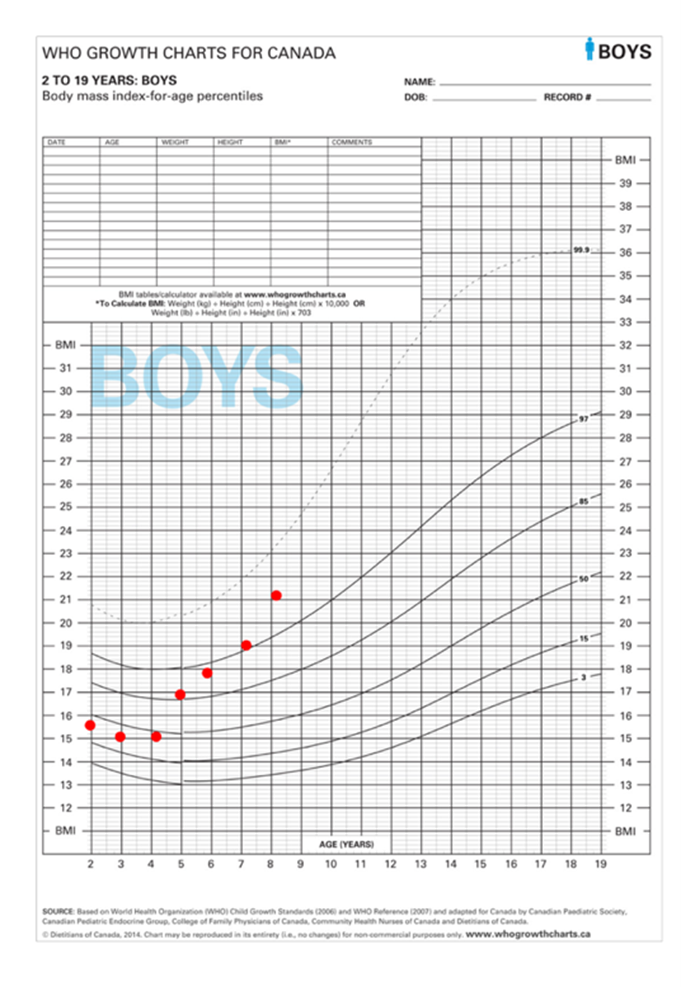
Figure 4. Growth charts for Ali
Interpretation
Ali’s weight is accelerating relative to his height, which suggests risk for overweight and potential for associated health risks, such as type 2 diabetes and hepatic steatosis. Calculating and plotting BMI provides a clearer representation of relative weight and height gain. In this case, rising BMI is attributable to weight gain because linear growth remained steady.
Response
A careful diet and medical history, a complete physical exam, and select investigations are required to eliminate suspicion of rare but important medical causes of excessive weight gain and identify comorbidities[8]. If history suggests high energy intake relative to needs, a more detailed exploration of underlying factors driving behaviour becomes essential. Often families are aware of healthier diet choices, but behaviour is determined by many factors. Understanding a family’s circumstances: financial constraints, time pressures, food insecurity, limited access to child care, and other social determinants of health, must predicate change (Figure 5).
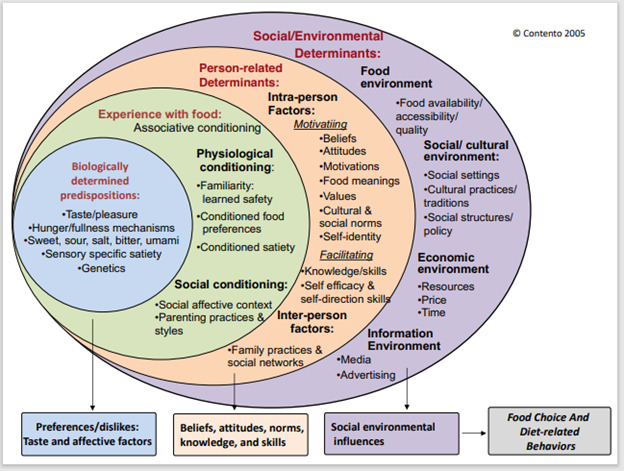
Figure 5. I. Contento. Social and environmental factors that influence food choices and dietary behaviours.
Identifying excessive weight gain can open a pathway to support behaviour change and improve child (and family) life and health outcomes. An excellent evidence-based resource with case studies to assist discussions about weight concerns is available.
Comments:
- A leading challenge when addressing excessive weight gain in children is raising awareness of its importance for health. The prevalence of overweight makes it easier for parents to normalize a child’s weight gain[9][10], and they may also feel overwhelmed by the prospect of behaviour change.
- Encouraging family and child physical activities and routines is one element of healthy lifestyle change that can be promoted alongside dietary guidance. Regular physical activity is important for long-term health.
- Skills for effective conversations using a strengths-based approach (motivational interviewing or solution-focused coaching) can be learned from a range of online training modules[11].
- Health care providers should be aware of local resources, and connecting families with such programs is part of quality care.
Best practice points:
- Use standardized measurement techniques and tools for measurement, and well-maintained equipment to obtain valid anthropometrics.
- Use appropriate growth charts and correct for prematurity until children are 2 to 3 years of age. Weight-for-length (<2 years), body mass index (BMI) charts (>2 years), and z-scores aid weight status interpretation.
- Analyze growth patterns of weight, length or height, and weight for length or BMI using as much data over time as possible. Recognize how they change relative to each other as well as the timing and magnitude of changes. If it is not clear whether or not there is a growth concern, follow-up measurements may add clarity.
- Atypical growth patterns require further evaluation, beginning with medical, nutritional and social history, and physical examination. Consider the full causal picture: size of family members, medical history (diagnosed and potentially undiagnosed conditions), mental health, the feeding relationship, financial constraints, and lifestyle. Investigations (if needed) require individualization based on history and physical examination, to inform diagnosis and/or consequences of growth impairment.
- Growth assessment is a screening, rather than diagnostic process. Atypical growth patterns are not always pathological, but always require further evaluation. If medical, nutritional, or social concerns are not identified, careful follow-up without intervention is appropriate, and will often provide reassurance or clarity about etiology and concerns. Families should be encouraged to trust children’s appetites and satiety, not only to promote healthy eating but to raise concerns that may yield helpful information or an opportunity for counselling.
- Even when clinicians are confident that a child’s growth pattern is normal, anxious family members may not be easily reassured. When explanation of normal growth patterns is not reassuring for caregivers, it is important to explore the basis of their concerns, along with regular evaluation and reassurance.
- Under- and over-diagnosis of growth concerns and the use of stigmatizing labels (e.g., “obese”) can lead to harm. Discussions with children and families should focus on education and support, emphasizing that the purpose of investigations or interventions is to improve the health of the child, not to achieve a specific growth pattern.
- When diet or lifestyle changes (or both) are appropriate, parents often have the necessary knowledge but encounter barriers such as tight finances, food insecurity, or lack of time. Identifying such barriers can provide opportunities for collaborative problem-solving and connection with local supportive resources.
- Being familiar with local resources (e.g., paediatric dietitians, endocrinology clinics, weight management programs) and criteria for referral and waitlists is important for determining how best to access and use community-based services and expertise.
Acknowledgements
This practice point has been reviewed by the Community Paediatrics Committee of the Canadian Paediatric Society, and by members of the College of Family Physicians or Canada (CFPC), Child and Adolescent Health Member Interest Group.
CANADIAN PAEDIATRIC SOCIETY NUTRITION AND GASTROENTEROLOGY COMMITTEE (01/2022)
Members: Belal Alshaikh MD, Linda Casey MD (Past Member), Eddy Lau MD (Board Representative), Ana Sant’Anna MD (Chair), Gina Rempel MD, Pushpa Sathya MD, Rilla Schneider MD (Resident Member), Christopher Tomlinson MD (Past Member)
Liaisons: Sanjukta Basak MD (Canadian Pediatric Endocrine Group), Mark Corkins (American Academy of Pediatrics, Committee on Nutrition), Subhadeep Chakrabarti (Health Canada), Jennifer McCrea (Health Canada), Tanis Fenton (Dietitians of Canada), Laura N. Haiek (Breastfeeding Committee for Canada)
Principal authors: Linda Casey MD, Tanis R. Fenton RD, PhD
References
- Dietitians of Canada; Canadian Paediatric Society; College of Family Physicians of Canada; Community Health Nurses of Canada; Secker D. Promoting optimal monitoring of child growth in Canada: Using the new WHO growth charts. Can J Diet Pract Res 2010;71(1):e1-3. doi: 10.3148/71.1.2010.54.
- Casey LM; Canadian Paediatric Society, Nutrition and Gastroenterology Committee. Nutritional evaluation of the neurologically impaired child. Paediatr Child Health 2020;25(2):125(Abstract): https://cps.ca/documents/position/nutritional-evaluation-of-the-neurologically-impaired-child.
- Wang Z, Sauve RS. Assessment of postneonatal growth in VLBW infants: Selection of growth references and age adjustment for prematurity. Can J Pub Health 1998;89(2):109-14. doi: 10.1007/BF03404400.
- Canadian Paediatric Endocrine Group. Plotter: 2014 WHO Growth Charts for Canada, 0-2 years: https://cpeg-gcep.shinyapps.io/growth02/ (Accessed April 2, 2023).
- Powell FC, Farrow CV, Meyer C. Food avoidance in children. The influence of maternal feeding practices and behaviours. Appetite 2011;57(3):683-92. doi: 10.1016/j.appet.2011.08.011.
- Boots SB, Tiggemann M, Corsini N, Mattiske J. Managing young children’s snack food intake. The role of parenting style and feeding strategies. Appetite 2015;92:94-101. doi: 10.1016/j.appet.2015.05.012.
- Canadian Paediatric Endocrine Group. Plotter: 2014 WHO Growth Charts for Canada, 2-19 years: https://cpeg-gcep.shinyapps.io/growth219_DDE/ (Accessed April 2, 2023).
- Kleinendorst L, Abawi O, van der Voom B, et al. Identifying underlying medical causes of pediatric obesity: Results of a systematic diagnostic approach in a pediatric obesity centre. PLoS One 2020;15(5):e0232990. doi: 10.1371/journal.pone.0232990.
- McDonald SW, Ginez HK, Vinturache AE, Tough SC. Maternal perceptions of underweight and overweight for 6-8 years olds from a Canadian cohort: Reporting weights, concerns and conversation with healthcare providers. BMJ Open 2016;6(10):e012094. doi:10.1136/bmjopen-2016-012094.
- Sullivan SA, Leite KR, Shaffer ML, Birch LL, Paul IM. Urban parents’ perceptions of healthy infant growth. Clin Pediatr (Phila) 2011;50(8):698-703. doi: 10.1177/0009922811398960.
- Berge JM, MacLehose RF, Loth KA, Eisenberg ME, Fulkerson JA, Neumark-Sztainer D. Parent-adolescent conversations about eating, physical activity and weight: Prevalence across sociodemographic characteristics and associations with adolescent weight and weight-related behaviors. J Behav Med 2015;38(1):122-35. doi: 10.1007/s10865-014-9584-3.
Disclaimer: The recommendations in this position statement do not indicate an exclusive course of treatment or procedure to be followed. Variations, taking into account individual circumstances, may be appropriate. Internet addresses are current at time of publication.
Last updated: Apr 23, 2024

